
How to Track Gross Margin by Customer

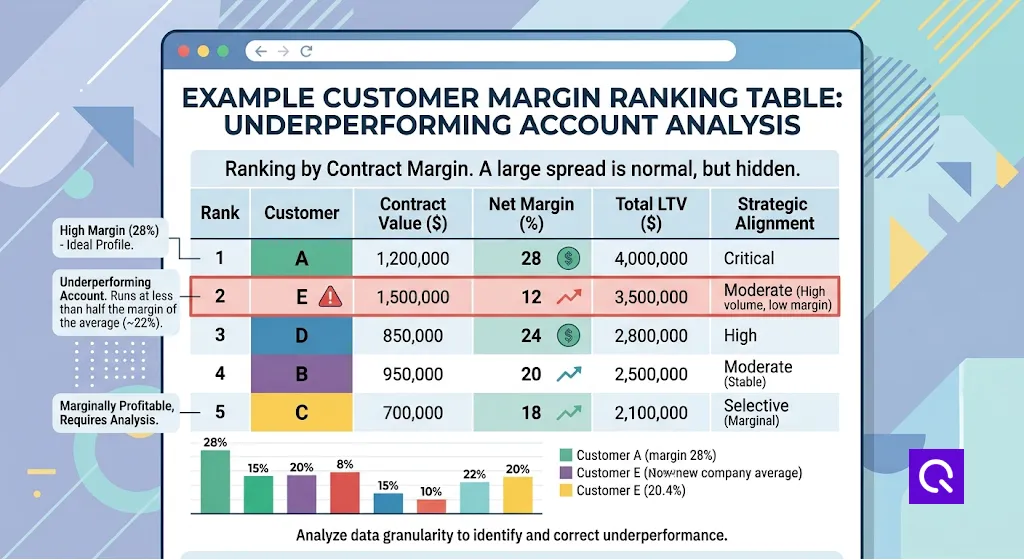
Our complete guide to gross margin makes the case that a company-wide average hides real problems underneath it. This is the practical follow-up: how to actually build a customer-level margin view, what data it requires, the methodology mistakes that quietly wreck the accuracy of the number, and why most ERPs make this harder than it should be.
Why Customer-Level Margin Tells a Different Story Than Company-Wide Margin
A 30% gross margin for the entire company is a number representing the average margin earned by every customer, every job, and every product line. Numbers represent averages and they compress information. And the type of information that they compress the best is the expensive one. That is, the customer who has been priced based on a certain level of value and whose relationship has now deviated from that point.
It occurs slowly and through very normal circumstances. The scope of work increases job after job without issuing a formal change order. The customer becomes accustomed to expedited shipping because of one exception that occurred in good will. The price has not been adjusted in three years even though material prices have changed two times. None of these things occur in a single event, but rather each of them slowly causes a specific customer’s margin to fall behind everyone else’s margin.
What Data You Actually Need
Revenue by customer is usually the easy half. Most accounting and ERP systems can produce that report natively, since invoices are already tied to a customer record. Cost of goods sold by customer is the harder half, and it requires pulling together several pieces that don’t always live in the same place.
Direct job costs mapped to the customer. Materials and direct labor need to be tracked at the job or order level, then rolled up by customer, not just tracked as a single company-wide COGS total. If job costing is inconsistent, some jobs tracked in detail, others estimated after the fact, the customer-level roll-up will be only as accurate as the weakest job record feeding into it.
Customer-specific costs that sit outside the base job cost. Expedited freight requested by a specific customer, warranty work or rework tied to that customer’s jobs, and any dedicated inventory or safety stock carried specifically for them all belong in their true cost picture, even when they get lumped into a general overhead account in the accounting system by default.
Every price concession actually given. Discounts, rebates, and any free service added to close or retain the relationship need to reduce that customer’s effective revenue, not just get netted somewhere else in the P&L where they no longer trace back to the specific account that received them.
Common Mistakes That Distort a Customer Margin Report
Allocating fixed overhead evenly across customers regardless of actual usage. A customer whose jobs run efficiently through the shop with minimal changeover time gets charged the same overhead allocation as a customer whose small, frequent orders create constant setup and changeover cost. Even splitting inflates the small, high-friction customer’s apparent margin and understates the efficient one’s, in exactly the wrong direction for decision-making.
Missing indirect costs that are real but not itemized by customer in the accounting system. Extra customer service time, engineering support on a difficult account, or additional quality inspection required by a specific customer’s specifications rarely get coded back to that customer specifically, which understates their true cost and overstates their margin.
Lumping small customers into an “other” bucket. A handful of smaller accounts, evaluated individually, sometimes reveals one or two that are meaningfully underpriced relative to the effort they require. Grouped together into a miscellaneous category, that signal disappears into an average that looks unremarkable.
Measuring once instead of tracking a trend. A single snapshot of customer margin tells you where things stand today. It doesn’t tell you whether a customer is stable, improving, or sliding, and a customer sliding from 32% to 24% over three quarters is a very different situation from one that has sat steadily at 24% the whole time, even though a single point-in-time report would show the same number for both.
Building a Customer Margin Report, Step by Step
Step 1: Pull revenue by customer for the period. Total invoiced revenue, net of any credits or returns already processed, for each customer over the period being measured.
Step 2: Pull job-level COGS and map every job to its customer. This is the step that breaks down if job costing isn’t consistent across the shop. If some jobs have detailed actual costs and others only have an estimate carried over from the original quote, flag which is which so the resulting customer margin isn’t presented with false precision.
Step 3: Add in the costs that sit outside the base job record. Expedited freight, warranty and rework tied to that customer, and any dedicated inventory carrying costs, matched back to the specific customer who generated them.
Step 4: Net out every price concession from that customer’s revenue. Discounts, rebates, and free services should reduce the top-line revenue figure used in the calculation, not disappear into a general adjustments account.
Step 5: Calculate margin per customer. (Customer Revenue − Customer COGS, including the additions from Steps 2 through 4) divided by Customer Revenue, expressed as a percentage, using the same gross margin formula covered in the main guide, applied at the customer level instead of the company level.
Step 6: Rank by margin, not by revenue size, and look at the trend. The biggest customer by revenue is not always the most profitable one, and ranking by margin percentage surfaces that gap immediately. Reviewing the same ranking over two or three periods, rather than once, is what actually catches a customer sliding in the wrong direction before it becomes a bigger problem.
An Illustrative Example
A shop with a healthy 30% company-wide gross margin runs this exercise across its top five customers by revenue:
Customer E is not the smallest account, but runs at less than half the margin of the rest.
| Customer | Share of Revenue | Gross Margin |
|---|---|---|
| Customer A | 28% | 34% |
| Customer B | 22% | 31% |
| Customer C | 19% | 29% |
| Customer D | 16% | 27% |
| Customer E | 15% | 12% |
Customer E is not the smallest account and is not an obvious outlier by revenue share. It is, however, running at less than half the margin of every other customer on the list, quietly dragging the blended average down while looking completely unremarkable on a revenue-ranked customer list. This is the exact pattern a company-wide average is structurally unable to surface, and it is also the most common single finding across the pilot audits referenced in Quanzar’s research into where contract manufacturers lose margin.
Why Most ERPs Make This Harder Than It Sounds
Prophet 21, NetSuite, SAP, and Epicor all report revenue by customer natively, and most can produce a rough COGS-by-customer view if job costing is entered consistently. Where they typically fall short is in pulling together the pieces outlined above, expedite costs, rework tied to a specific account, discounts netted properly, into one clean customer-level margin figure without a custom report build, and in refreshing that view often enough to catch a customer sliding in real time rather than finding out at month-end once the accounting close is finished. Our breakdown of why an ERP alone won’t save your margins goes deeper into this specific gap and why it is a structural limitation of month-end reporting rather than a flaw in any one system.
This is also the exact problem Quanzar’s Margin Intelligence is built around: pulling job-level cost and revenue data directly from the systems already in place and surfacing customer and job margin continuously, rather than as a manual spreadsheet exercise rebuilt from scratch every quarter.
Frequently Asked Questions
How do you calculate gross margin by customer?
Subtract that customer’s total cost of goods sold, including job costs plus any customer-specific costs like expedited freight or rework, from that customer’s total revenue net of discounts and credits, then divide by that customer’s revenue. It’s the standard gross margin formula applied at the customer level instead of the company level.
Why is my top revenue customer not my top margin customer?
Revenue size and profitability measure different things. A large customer can carry thin margins due to volume-based pricing concessions, frequent expediting, or scope that has crept beyond the original quote, while a smaller customer priced correctly and executed efficiently can carry a much higher margin on far less revenue.
How often should I review customer margin?
Monthly is a reasonable minimum for most job-based manufacturers, but the more useful cadence is continuous, at the job level, so a specific job or customer relationship that starts drifting can be caught while there’s still time to address it, rather than discovered after a month or a quarter has already closed.
What data do I need to track margin by customer?
Revenue by customer, job-level cost of goods sold mapped back to each customer, any customer-specific costs sitting outside the base job record such as expedited freight or warranty work, and every discount or rebate actually applied, netted against that customer’s revenue.
Can Excel handle customer-level margin tracking?
For a small number of customers and consistent job costing, yes, a well-built spreadsheet can produce an accurate customer margin report. It becomes harder to maintain as the customer count and job volume grow, since it depends entirely on someone manually pulling and reconciling data from several sources every period, which is where the process tends to break down or fall out of date.
The Bottom Line
A gross margin for an entire organization will give us an answer to one question easily: How is the business doing? However, the gross margin cannot provide an answer to another important and useful question: Which customer relationships are truly contributing to the success of the business, and which are being quietly supported by all others? The development of such information requires some effort to be put in, as costs should be tracked according to the customers and concessions identified from a general ledger. Once created, such a report usually reveals at least one relationship worth discussion.
If building this by hand isn’t realistic given your current systems, Quanzar’s free 10-minute margin audit produces a version of this view automatically from your last several jobs, no spreadsheet rebuild required.