
Gross Margin Explained: Formula, Benchmarks & Examples

Gross margin is one of those numbers everyone in finance throws around and almost nobody outside finance fully trusts themselves to calculate. That is a problem, because gross margin is arguably the single most useful profitability metric a business owner, controller, or operations leader can track month to month. It tells you, in one percentage, how much of every sales dollar survives the direct cost of making or delivering whatever you sold. Everything else the business spends money on, rent, salaries, marketing, interest, taxes, gets paid out of what is left.
This guide covers what gross margin actually means, how to calculate it correctly (including the version of the formula that trips people up), what counts as a good gross margin depending on your industry, and how gross margin differs from gross profit, net margin, operating margin, and contribution margin, four terms that get used almost interchangeably and should not be. It also covers the question generic definitions tend to skip: what actually causes gross margin to move, and why a healthy looking number on a company wide income statement can still be hiding real problems at the job or customer level.
What Is Gross Margin? A Simple Definition
Gross margin is the percentage of revenue a business keeps after subtracting the direct cost of producing or delivering what it sold. It measures the profitability of the product or service itself, before any of the overhead required to run the business gets factored in.
If gross margin is 35%, that means for every $1 of sales, $0.35 remains after covering the cost of goods sold (COGS): materials, direct labor, freight in, and other costs tied directly to the item. The remaining $0.65 went to producing the product. What happens to that $0.35 next, rent, payroll, marketing, debt service, taxes, is not part of gross margin. That is the job of the metrics further down the income statement, covered later in this guide.
It is worth being precise about the word “margin” here, because it gets used two different ways in casual conversation, and this is where a lot of the confusion around gross margin starts. Gross margin, used correctly, is a percentage. Gross profit is the dollar amount. Some people say “gross margin” when they mean gross profit dollars, as in “our gross margin was $2 million this quarter.” In casual conversation, that is harmless. On a spreadsheet or in a set of KPIs, it is worth keeping the two separate, because a rising gross profit dollar figure and a rising gross margin percentage do not always move together. A growing business can see both move in opposite directions at the same time, and that gap is often the first sign of a pricing problem long before it shows up anywhere else.
Gross Margin Formula (With a Worked Example)
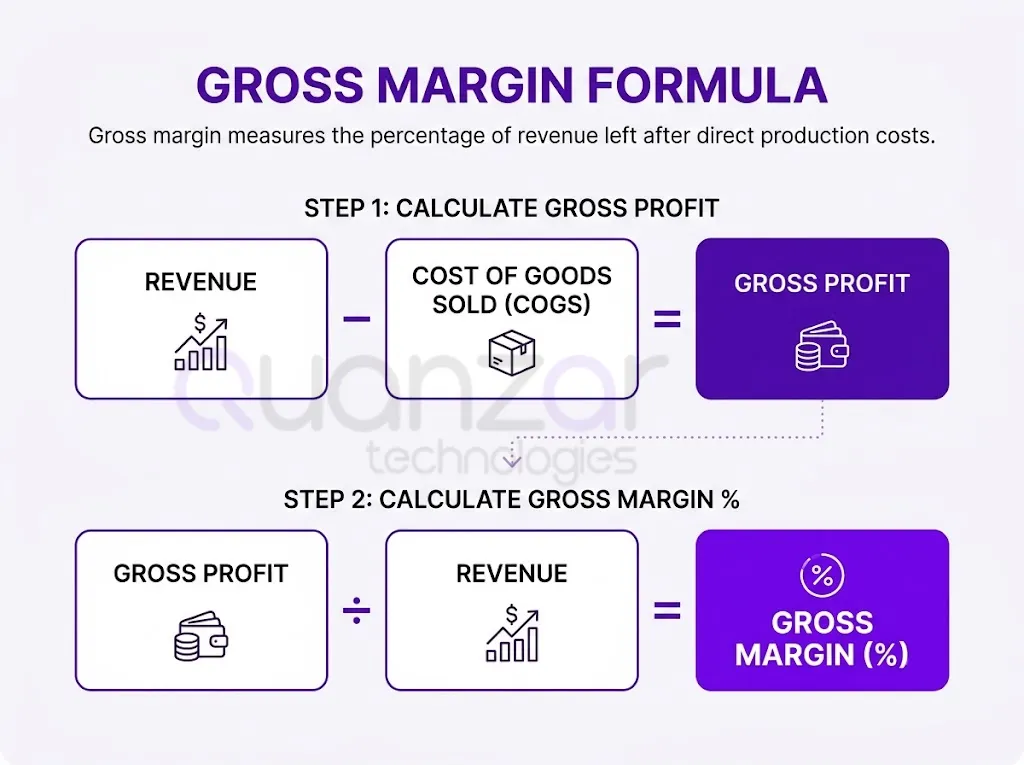
The gross margin formula is:
Gross Margin (%) = ((Revenue − COGS) / Revenue) × 100
Revenue minus COGS is gross profit, so the formula can also be written as:
Gross Margin (%) = (Gross Profit / Revenue) × 100
Both versions produce the same number. The first is more useful when working straight from raw numbers, an invoice and a cost sheet, for example. The second is more useful once gross profit is already calculated, such as pulling it directly off an income statement.
Here is a worked example. A contract manufacturer runs a job that bills at $80,000. The direct costs, materials, direct labor, and any subcontracted work tied specifically to that job, come to $54,000.
Gross Profit = $80,000 − $54,000 = $26,000
Gross Margin = ($26,000 / $80,000) × 100 = 32.5%
That 32.5% is the number that belongs on a quote sheet, a job costing report, or a monthly P&L review. The $26,000 is the number that belongs on a bank deposit slip. Both matter, but they answer different questions. The percentage tells you whether the job was priced well relative to its size. The dollar figure tells you how much cash it actually put in the business.
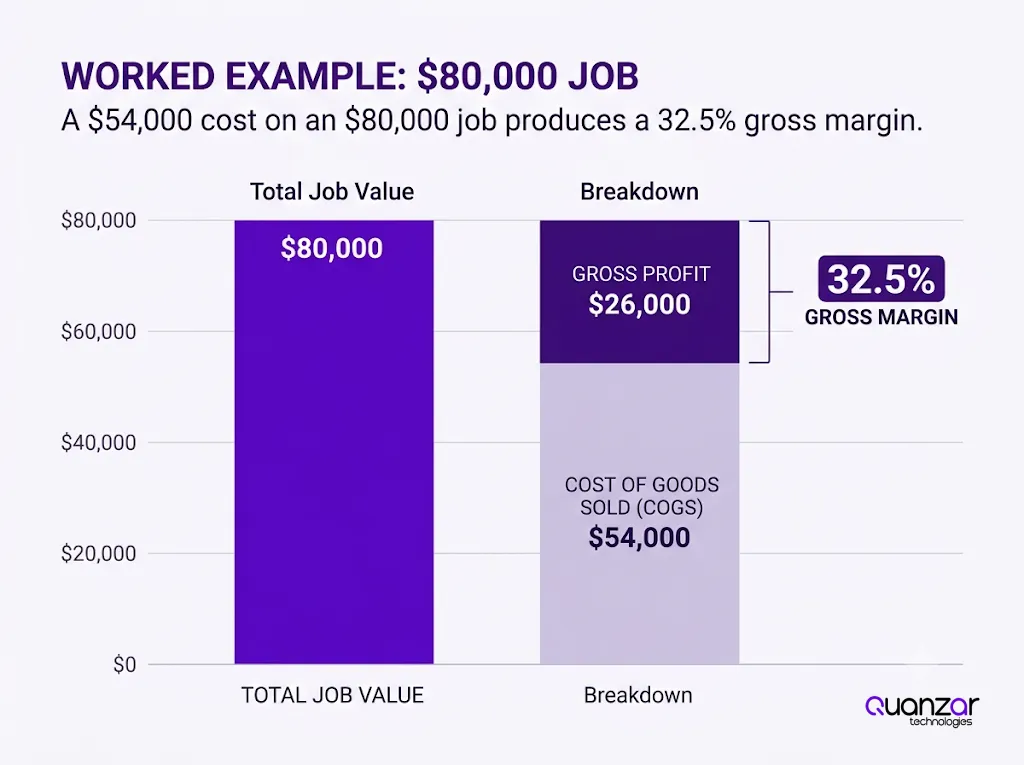
A $54,000 cost on an $80,000 job produces a 32.5% gross margin.
How to Calculate Gross Margin in Excel
The spreadsheet version of the formula is identical, just with cell references. If revenue sits in cell B2 and COGS sits in cell C2, the formula is =(B2-C2)/B2, formatted as a percentage. This is the version most people are searching for when they look up how to calculate gross margin in Excel, and the most common mistake at this step is not the formula itself. It is what gets included in COGS in the first place, which is covered in detail further down.
Gross Margin vs. Markup: The Calculation Everyone Eventually Confuses
Markup and gross margin both compare price to cost, but they use different denominators, and that difference produces two different looking numbers from the exact same job.
Markup (%) = (Gross Profit / COGS) × 100
Using the same $80,000 job with $54,000 in costs: Markup = ($26,000 / $54,000) × 100 = 48.1%. Same job, same dollars, but a 32.5% gross margin and a 48.1% markup. This is the exact confusion behind the common question of whether a 20% margin is the same as a 25% markup, and it is not just semantic. A sales rep told to “mark up jobs by 30%” and a controller told to “hold a 30% margin” are targeting two different price points on the exact same job. Mixing the two up is one of the more common, and quietly expensive, pricing mistakes in any business that quotes jobs individually rather than selling off a fixed price list.
Gross Margin vs. Gross Profit: Are They the Same?
No, though they are closely related and often used loosely in conversation. Gross profit is a dollar amount: revenue minus cost of goods sold, full stop. Gross margin is that same relationship expressed as a percentage of revenue.
The distinction matters because gross profit and gross margin can tell different stories depending on how a business is growing. A company can grow gross profit dollars every year while its gross margin percentage slowly erodes: more revenue, but each dollar of that revenue is less profitable than it used to be. That pattern shows up constantly in businesses that win new customers through discounting, or that see input costs rise faster than the prices they are able to pass on. On a bank statement, growing gross profit dollars looks like a good year. On a gross margin trend line, the same year can look like a warning sign.
The reverse also happens. A smaller, more disciplined book of business can carry a higher gross margin percentage while producing fewer total gross profit dollars than a larger, lower margin one. Neither number tells the full story on its own, which is exactly why both belong side by side on a well built P&L rather than being treated as interchangeable.
What Is a Good Gross Margin? Benchmarks by Industry
This is the question behind most gross margin searches, and the honest answer is that “good” depends entirely on the industry, because gross margin is a direct reflection of how much of a product’s cost sits in materials and direct labor versus everything else.
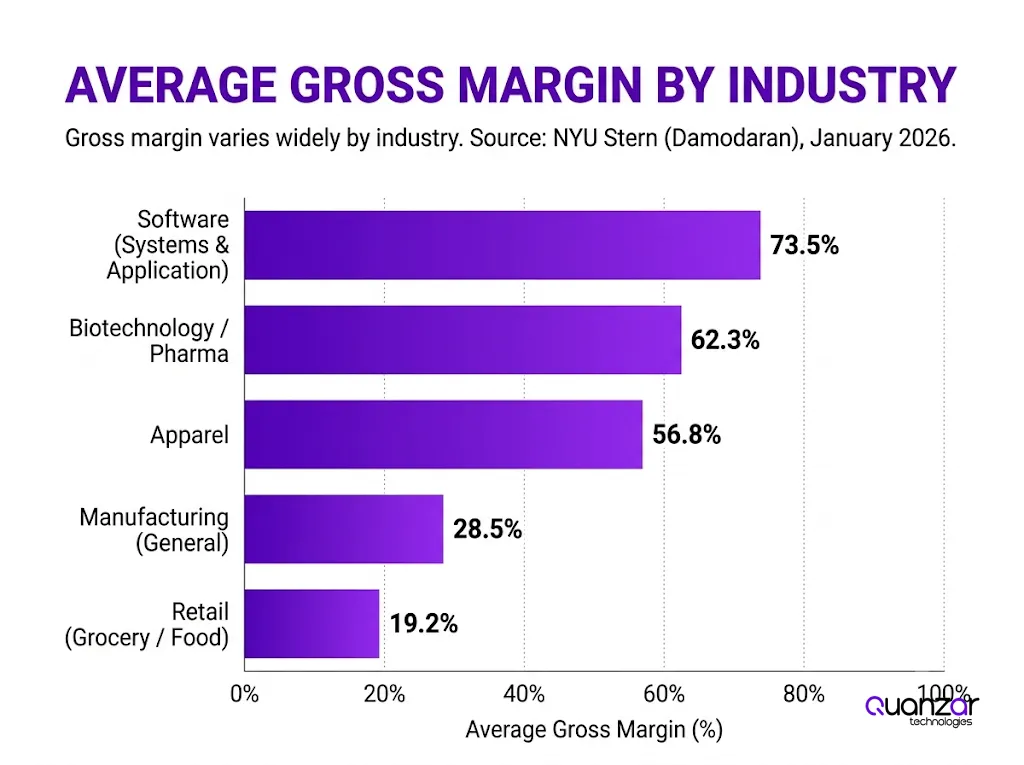
Gross margin varies widely by industry. Source: NYU Stern (Damodaran), January 2026.
| Industry | Average Gross Margin |
|---|---|
| Software (system & application) | 71.7% |
| Semiconductors | 59.0% |
| Machinery | 37.5% |
| Metals & mining | 34.7% |
| Retail (general) | 33.2% |
| Restaurant / dining | 32.2% |
| Retail (distributors) | 30.6% |
| Electronics (general) | 26.8% |
| Retail (grocery & food) | 26.3% |
| Construction supplies | 25.5% |
| Food processing | 23.2% |
| Auto parts | 15.8% |
| Chemical (basic) | 9.3% |
| Total market (excl. financials) | 34.4% |
Source: Aswath Damodaran, NYU Stern School of Business, industry margin dataset, data as of January 2026.
Software companies post gross margins in the 70s because the marginal cost of another software license is close to zero. Grocery retailers post gross margins in the mid 20s because they are reselling low margin physical goods on thin markups. Neither number reflects better management. They reflect fundamentally different cost structures, and comparing a software company’s margin to a manufacturer’s margin tells you nothing useful about either one.
Two things are worth flagging about benchmarks like these. First, they reflect publicly traded companies, which tend to be larger, more established, and often somewhat more efficient than small and midsize private businesses in the same industry. A smaller private manufacturer running a few points below the public company average in its sector is not automatically underperforming. Second, gross margin in datasets like this is calculated consistently across companies using standardized public filings, which is not always true of internally tracked numbers, especially in businesses where COGS gets defined slightly differently from job to job or department to department. More on that in the next section.
For a manufacturer or industrial distributor specifically, gross margin in the high 20s to high 30s is typical territory. Quanzar’s own pilot data across contract manufacturers and industrial distributors puts the more pressing issue not at the company wide average, but at the spread underneath it: margin leakage, the gap between what a job was quoted at and what it actually realized, that Quanzar’s published case studies report running 15 to 30 percent of intended margin on individual jobs, even when the company wide number looks perfectly healthy on paper.
A higher gross margin is not automatically better in every case. Margin needs volume context. A 45% margin on a small number of jobs can produce less total profit than a 28% margin on a much larger book of business. The percentage tells you how efficiently each dollar of revenue converts to profit. It does not tell you, by itself, whether the business is generating enough of those dollars to cover everything else it needs to pay for.
Gross Margin vs. Net Margin vs. Operating Margin vs. Contribution Margin
These four margins measure profitability at different points on the income statement, and most of the confusion between them is really confusion about which costs have already been subtracted.
Think of the income statement as a waterfall. Revenue is the starting number. Subtract cost of goods sold, and what is left is gross profit, expressed as gross margin. Subtract operating expenses (SG&A, rent, marketing, most salaries not tied directly to production) from gross profit, and what is left is operating profit, expressed as operating margin. Subtract interest and taxes from operating profit, and what is left is net income, expressed as net margin.
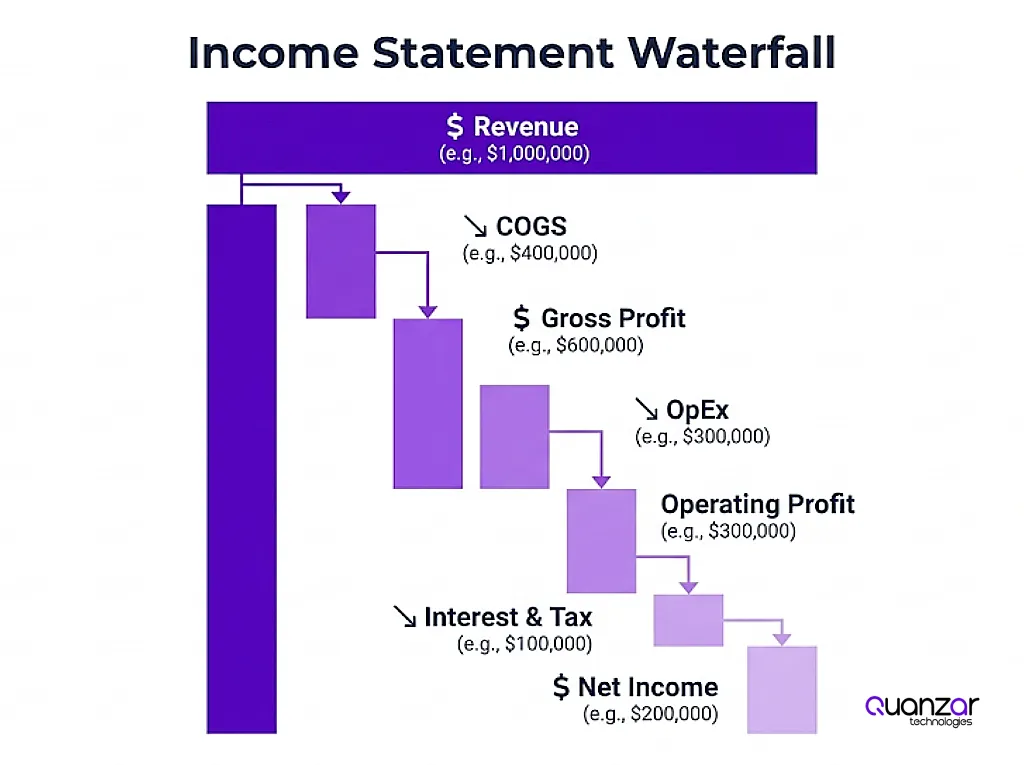
Each margin subtracts a different layer of cost from revenue.
| Step | Calculation | Resulting Margin |
|---|---|---|
| Start | Revenue | — |
| Subtract COGS | Revenue − COGS = Gross Profit | Gross Margin |
| Subtract operating expenses | Gross Profit − OpEx = Operating Profit | Operating Margin |
| Subtract interest & tax | Operating Profit − Interest − Tax = Net Income | Net Margin |
Contribution margin sits slightly outside this waterfall, because it is a management accounting concept rather than a line item required on a GAAP income statement. Contribution margin subtracts only variable costs from revenue, costs that scale directly with each unit sold or job run, regardless of whether those costs are officially classified as COGS or as an operating expense. In many manufacturing businesses, contribution margin and gross margin land close to each other, because most direct costs are also variable costs. But they can diverge meaningfully when a business has fixed costs baked into COGS, a factory lease allocated per unit, for example, or variable costs sitting outside COGS, a sales commission paid per job. Contribution margin is the number used for break even analysis and short term “should we take this job” decisions. Gross margin is the number used for external reporting and longer term pricing strategy.
A quick example makes the contribution margin distinction concrete. Take the same $80,000 job from earlier, with $54,000 in COGS and a resulting 32.5% gross margin. Suppose $6,000 of that $54,000 is a fixed facility charge allocated to the job rather than a cost that actually varies with it, and the sales rep also earns a $2,000 commission on the job, booked as an operating expense rather than COGS. Contribution margin strips out the fixed allocation and adds back the true variable cost of winning the sale: ($80,000 − $54,000 + $6,000 − $2,000) / $80,000 = 37.5%. Gross margin and contribution margin land five points apart on the exact same job, not because either number is wrong, but because they are answering different questions. Gross margin follows accounting convention for external reporting. Contribution margin follows what actually changes if the job disappears tomorrow.
EBITDA margin sits in a related but separate lane. It adds back depreciation and amortization to operating margin, which makes it useful for comparing companies with very different capital structures, a business that owns a lot of equipment versus one that leases most of it, for example. That is exactly why private equity firms lean on EBITDA margin during due diligence. But EBITDA margin can mask a gross margin problem. A business can show a healthy consolidated EBITDA while individual jobs or product lines are quietly losing money at the gross margin level underneath it, a gap that Quanzar’s research into operational due diligence for industrial acquisitions found hiding inside deals that looked clean at the EBITDA level.
What Gross Margin Does (and Does Not) Include
This is where most of the “does gross margin include X” questions live, and the short answer is that gross margin includes cost of goods sold and nothing else. The confusion comes from the fact that what belongs in COGS is more of a judgment call than most people expect, and it varies by industry and even by company.
COGS typically includes raw materials, direct labor tied to producing the specific product or job, freight in on materials, and manufacturing overhead directly tied to production, such as machine depreciation on the production line or the utility cost of running the factory floor.
COGS typically does not include sales salaries and commissions, marketing and advertising, office rent and admin overhead, R&D not tied to a specific product, interest expense, or income tax. Those are operating expenses, interest expense, and tax, subtracted further down the income statement to arrive at operating margin and net margin.
A few of the specific questions that come up most often, answered directly:
- Overhead: Only production related overhead, factory rent, equipment depreciation on the production line, belongs in COGS. Corporate office overhead does not.
- Labor: Direct labor on the product, yes. Sales, admin, and executive salaries, no.
- Salaries: Same distinction as labor above. Production staff, yes. Everyone else, no.
- SG&A: No. SG&A sits below gross profit, in the operating expense section of the income statement.
- Depreciation: Only depreciation on production equipment. Depreciation on office equipment or sales vehicles does not belong in COGS.
- Shipping and freight: Freight in, getting materials to the factory, belongs in COGS. Freight out, shipping the finished product to the customer, is usually booked as a selling expense, though practice genuinely varies by company here. Consistency matters more than which convention gets chosen.
- Marketing: No.
- Tax: No. Income tax is subtracted after operating margin, not as part of COGS.
- Customer acquisition cost (CAC): No. CAC is a sales and marketing expense, not a production cost.
The reason this matters practically, beyond passing a bookkeeping test, is that if COGS gets defined slightly differently from job to job, rep to rep, or month to month, the gross margin number stops being comparable to itself over time. That is exactly the kind of quiet inconsistency that lets a month end margin report look stable while individual jobs are actually drifting underneath it.
Can Gross Margin Be Negative or Over 100%?
Yes to both questions, though for different reasons, and neither is common in a healthy business.
Negative gross margin happens when COGS exceeds revenue, meaning a company is selling something for less than it costs to make. This happens more often than people assume: a startup pricing aggressively to win early customers, a retailer liquidating inventory at a loss to free up cash, or a manufacturer that priced a job using stale cost data and got caught by a spike in material prices before the job was delivered. A single job or product line running a negative gross margin is not necessarily a crisis. A company wide negative gross margin, averaged across everything sold, is a sustainability problem that needs to be addressed immediately, because at that point the business loses money on every additional unit it sells. More revenue makes the problem worse, not better.
Gross margin over 100% is mathematically impossible under the standard formula, since COGS cannot be negative in a normal transaction, but the question comes up often enough that it is worth answering directly: gross margin percentage cannot exceed 100%, because that would require a negative cost of goods sold. What can exceed 100% is markup, since markup compares profit to cost rather than to revenue, and a high margin, low cost item can carry a markup well above 100% while its gross margin stays comfortably under 100%. If a gross margin calculation is producing a number above 100%, the likely explanation is a data error: revenue and COGS pulled from mismatched time periods, a refund or credit not properly netted out, or COGS entered as a negative number by mistake, rather than a genuinely unusual business result.
How to Improve Gross Margin (Without Just Raising Prices)
Raising prices is the fastest lever, but it is also the one most businesses reach for first and the one customers push back on hardest. Several other places typically hide margin, especially in businesses that quote jobs individually rather than sell off a fixed catalog.
Pricing accuracy at the quote stage. A meaningful share of margin erosion does not happen because a job was priced too low on purpose. It happens because it was priced using outdated cost data, a gut feel estimate, or a rushed quote turned around under competitive pressure. Pulling actual historical cost data into every quote, rather than pricing from memory or a static spreadsheet, is one of the more reliable ways to close that gap before a job even starts.
Renegotiating or re-scoping underperforming customers. Not every customer relationship needs to run at the same margin, but a customer that has quietly drifted well below the margin they were originally quoted at deserves a pricing conversation before the relationship, not several more months of underpriced work.
Reducing material cost through better purchasing. Renegotiating supplier terms, consolidating purchase volume, or qualifying alternate suppliers on high cost line items directly reduces COGS without touching the price charged to the customer.
Cutting waste and rework. Scrap, rework, and expedited freight to fix a missed deadline all land inside COGS. Reducing them improves gross margin even if pricing and material costs stay exactly the same.
Improving labor efficiency on the production floor. Direct labor is usually the second largest COGS line after materials. Reducing the labor hours required per unit, through better scheduling, less downtime between jobs, or targeted process improvements, moves gross margin without a single pricing conversation.
Catching drift while a job is still open, not after it closes. This is the lever most standard job costing systems genuinely cannot offer, because most ERPs report margin after a job closes, once the money is already spent. A job that starts drifting below its quoted margin in week two of a six week build is still fixable in week two. By month end, when the report finally shows it, it usually is not. Quanzar’s research into where contract manufacturers lose margin breaks down the five most common structural leak points found across pilot audits, and it is worth reading alongside this section if margin has been slipping without an obvious cause.
How Often Should You Track Gross Margin?
Most businesses check gross margin monthly, because that lines up with the standard accounting close and the P&L review most finance teams already run. For a company selling a consistent product off a price list, that cadence is usually fine. Margin does not move much week to week when the product, the pricing, and the cost structure stay stable.
That assumption breaks down fast in any business that quotes work individually: contract manufacturers, custom fabricators, industrial distributors pricing RFQs, service businesses billing by the project. In those businesses, gross margin is really an average of dozens or hundreds of individual job margins, each one locked in the moment a quote goes out and each one vulnerable to drifting the moment actual costs diverge from what was quoted. A monthly average can look completely stable while three or four jobs underneath it are quietly bleeding margin the entire time, and nobody finds out until the month closes and the damage is already spent.
The more useful cadence for these businesses is tracking margin at the job level, in real time, while the job is still open rather than after it closes. A job that drifts 10 points below its quoted margin in week two of a six week build is still a fixable pricing or scope conversation. The same drift, discovered in a month end report six weeks later, is a number to explain in a meeting rather than a problem anyone can still do something about. Monthly gross margin is the right number for reporting to a bank or a board. It is the wrong cadence for actually managing where margin is going.
Common Mistakes When Calculating Gross Margin
Most gross margin errors are not math errors. The formula itself is one line of arithmetic. The mistakes happen in what goes into the two inputs, revenue and COGS, before that arithmetic ever runs.
Mixing revenue periods with cost periods. Comparing this month’s revenue against last month’s cost of goods, because of a lag in when costs get entered into the accounting system, produces a gross margin number that does not describe any real period of business activity. This is one of the more common causes of a gross margin figure that looks unusually high or unusually low for no obvious reason.
Inconsistent COGS definitions across jobs or departments. If one job includes freight-out in COGS and another books it as a selling expense, the two jobs are not actually comparable on a margin basis, even though the reports show a clean percentage for each. This is especially common in businesses that have grown through acquisition, where each acquired unit brought its own accounting conventions along with it.
Confusing margin and markup when setting prices. Covered in detail earlier in this guide, but worth repeating as a standalone mistake: a pricing policy that says “add 30%” without specifying whether that 30% is a margin or a markup will produce a different price every time someone applies it inconsistently, and the two versions of that price differ by real money on anything but a small job.
Averaging away the problem. A company wide gross margin of 30% feels reassuring, and it can be true and still hide five jobs running at a loss and five running at 45% that are quietly subsidizing them. Reporting only the average, without ever looking at the distribution underneath it, is less a calculation mistake than a reporting habit that lets real problems go unnoticed for months.
Treating a snapshot as a trend. A single month’s gross margin number says very little on its own. The number that actually matters for decision making is the trend line: is margin on a given customer, product line, or rep’s book of business moving up or down over the last two or three quarters, and why.
Why Gross Margin Alone Is Not Enough for Manufacturers and Distributors
A company wide gross margin number is an average, and averages hide exactly the kind of problem that costs the most money. A business running a healthy 32% gross margin overall can still have three customers quietly running at 18%, a handful of jobs that are actively losing money, and a couple of reps who are consistently pricing below what the rest of the team charges for comparable work. None of that shows up until someone looks at margin by job, by customer, or by rep, rather than at the company wide average on the monthly P&L.
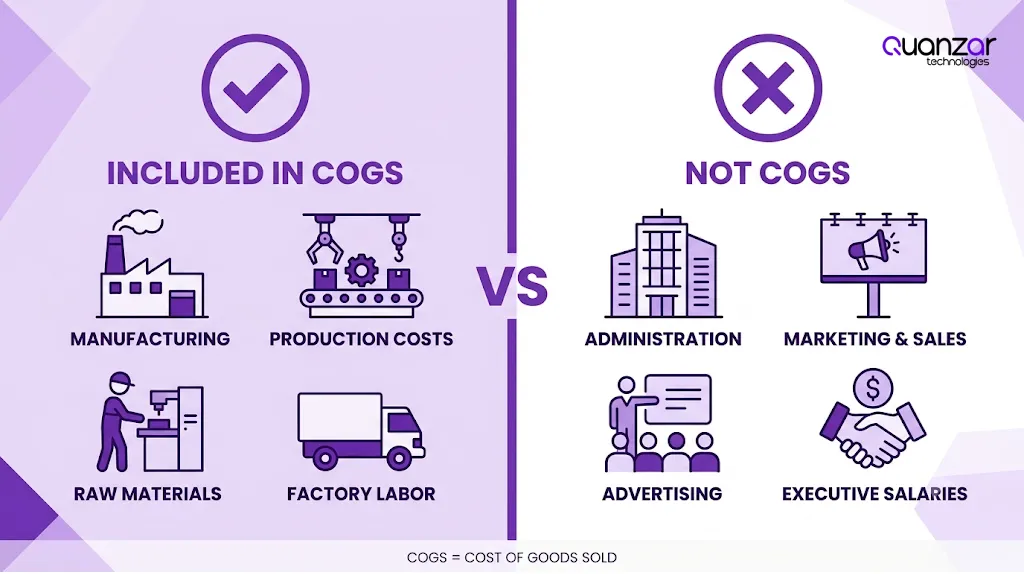
Only direct production costs belong in COGS.
This is also true for industrial distributors, where the mechanics look slightly different but the blind spot is the same. Distributors carry thinner gross margins than manufacturers on average, since they are reselling rather than producing, which means small amounts of unnoticed discounting or freight absorption erode margin faster and with less room to recover. Quanzar’s analysis of the industrial distributor’s margin problem covers why growing revenue without order level visibility tends to destroy profit rather than protect it.
It is also worth being honest about why this blind spot exists in the first place. It is not a flaw in the gross margin metric itself. Prophet 21, NetSuite, SAP, and Epicor all report gross margin accurately after a job has closed.
The issue is that standard reports do not flag a job that is drifting below target while there is still time to catch it. That is a structural limitation of month-end reporting, rather than a problem with the underlying number.
Quanzar’s breakdown of why an ERP alone will not save your margins gets into this distinction in more depth. It highlights exactly the visibility gap that a live, job-level view of gross margin—tracked continuously rather than reviewed once a month—is built to close.
If gross margin is running healthy at the company level but something still feels off, month end surprises, customers that seem profitable on paper but never quite pay off, quotes taking days instead of hours, running a free 10-minute margin audit on the last several jobs is a faster way to find out where the gap actually lives than waiting for the next month end close. For a look at what that looks like in practice, Quanzar’s case studies walk through real pilots, including one where a Houston contract manufacturer found $284,000 in identified leakage and recovered $170,000 of it within 60 days.
Frequently Asked Questions About Gross Margin
What is gross margin in simple terms?
Gross margin is the percentage of each sales dollar a business keeps after paying the direct cost of making or delivering what it sold. A 35% gross margin means 35 cents of every dollar in sales is left over to cover everything else the business spends money on.
What is the formula for gross margin?
Gross margin equals revenue minus cost of goods sold, divided by revenue, multiplied by 100 to express it as a percentage. It can also be written as gross profit divided by revenue.
Is gross margin the same as gross profit?
No. Gross profit is a dollar figure, revenue minus COGS. Gross margin is that same figure expressed as a percentage of revenue. The two terms get used interchangeably in casual conversation, but they answer different questions.
What is a good gross margin?
It depends entirely on the industry. Software companies often run gross margins above 70%, while grocery retailers typically run in the mid 20s. For manufacturers and industrial distributors, gross margin in the high 20s to high 30s is common, though the right benchmark is the specific subsector, not manufacturing as a whole.
Can gross margin be negative?
Yes. A negative gross margin means the cost of goods sold is higher than revenue, so the company is losing money on the product itself before any overhead is even factored in. It shows up more often on individual jobs or product lines than across an entire company.
Does gross margin include overhead or labor costs?
It includes direct labor and production related overhead, like factory rent or equipment depreciation tied to manufacturing. It does not include corporate overhead, sales salaries, marketing, or administrative costs. Those are operating expenses, subtracted further down the income statement.
What is the difference between gross margin and net margin?
Gross margin only subtracts the direct cost of production from revenue. Net margin subtracts everything, cost of goods sold, operating expenses, interest, and taxes, leaving whatever profit is actually left at the very bottom of the income statement.
Is it better to use margin or markup when pricing a job?
Neither is inherently better, but they are not interchangeable, and mixing them up leads to underpriced jobs. Margin is calculated against revenue, the selling price. Markup is calculated against cost. A 30% margin and a 30% markup on the same job produce two different prices, so it matters which one a pricing policy actually specifies.
What is the difference between gross margin and operating margin?
Gross margin subtracts only the direct cost of production (COGS) from revenue. Operating margin goes one step further and also subtracts operating expenses like sales salaries, marketing, rent, and admin overhead. A business can have a strong gross margin and a weak operating margin if its overhead is too high relative to its revenue, which is why the two numbers are usually reviewed together rather than in isolation.
What causes gross margin to increase or decrease?
Gross margin moves when either revenue per unit or cost per unit changes relative to the other. It increases when prices rise faster than costs, when material or labor costs fall, or when waste and rework decrease. It decreases when input costs rise faster than pricing, when discounting increases to win or retain customers, or when inefficiency, scrap, rework, expedited freight, quietly inflates the cost side of the equation without anyone changing the price.
Does a higher gross margin always mean a more profitable business?
Not by itself. Gross margin measures the profitability of a single sale, not the profitability of the whole business. A high gross margin business with heavy overhead or low sales volume can still lose money overall, while a lower gross margin business with tight cost control and strong volume can be highly profitable. Gross margin needs to be read alongside operating margin, net margin, and volume to say anything definitive about overall profitability.
The Bottom Line
Gross margin is a simple formula that hides a surprising amount of nuance once it gets applied to a real business instead of a textbook example. The percentage itself takes one line of arithmetic. Getting a number worth trusting, and acting on before a job closes rather than after, is the harder and more useful problem to solve.
If you want to see where your own gross margin is quietly slipping by job, customer, or rep, Quanzar’s free 10-minute margin audit turns your last 5 to 15 jobs into a one page report with a red, amber, or green health score, no sales call required. Prefer to talk it through first? Book a 30-minute diagnostic call directly with the Quanzar team.