Margin Erosion as Topology Failure:
Why Mid-Manufacturers Lose Margin Without Losing Customers
A structural analysis of how execution topology — not market conditions — drives the slow, invisible compression of gross margin in mid-sized manufacturing operations, and the five-channel framework required to close it permanently.
Mid-sized manufacturers frequently experience gradual margin compression despite stable demand, no major pricing pressure, and no visible operational failure. Financial statements reveal a slow bleed: rising production variance, inventory adjustments, increasing rework costs, expedited freight charges, and growing overtime dependency. Leadership routinely attributes this compression to market volatility, supplier unreliability, or individual personnel failures. In the majority of cases, the underlying cause is structural — it is execution topology failure. This whitepaper identifies the precise mechanisms through which operational topology erodes gross margin, and defines the structural interventions required to permanently close the leakage channels.
1. The Hidden Nature of Margin Loss
Manufacturing margin loss in mid-sized operations rarely appears as a single, dramatic financial event. There is no catastrophic failure, no lost contract, no sudden price collapse. Instead, margin erodes in fragments across minor production delays that trigger overtime, across unstructured change orders that generate rework, across supplier substitutions that require expedited freight, across planning overrides that create inventory accumulation. Individually, each event is small enough to write off. Collectively, they constitute a systematic drain that can reduce a 10 percent net margin to 6 or 7 percent without a single customer complaint or visible operational crisis.
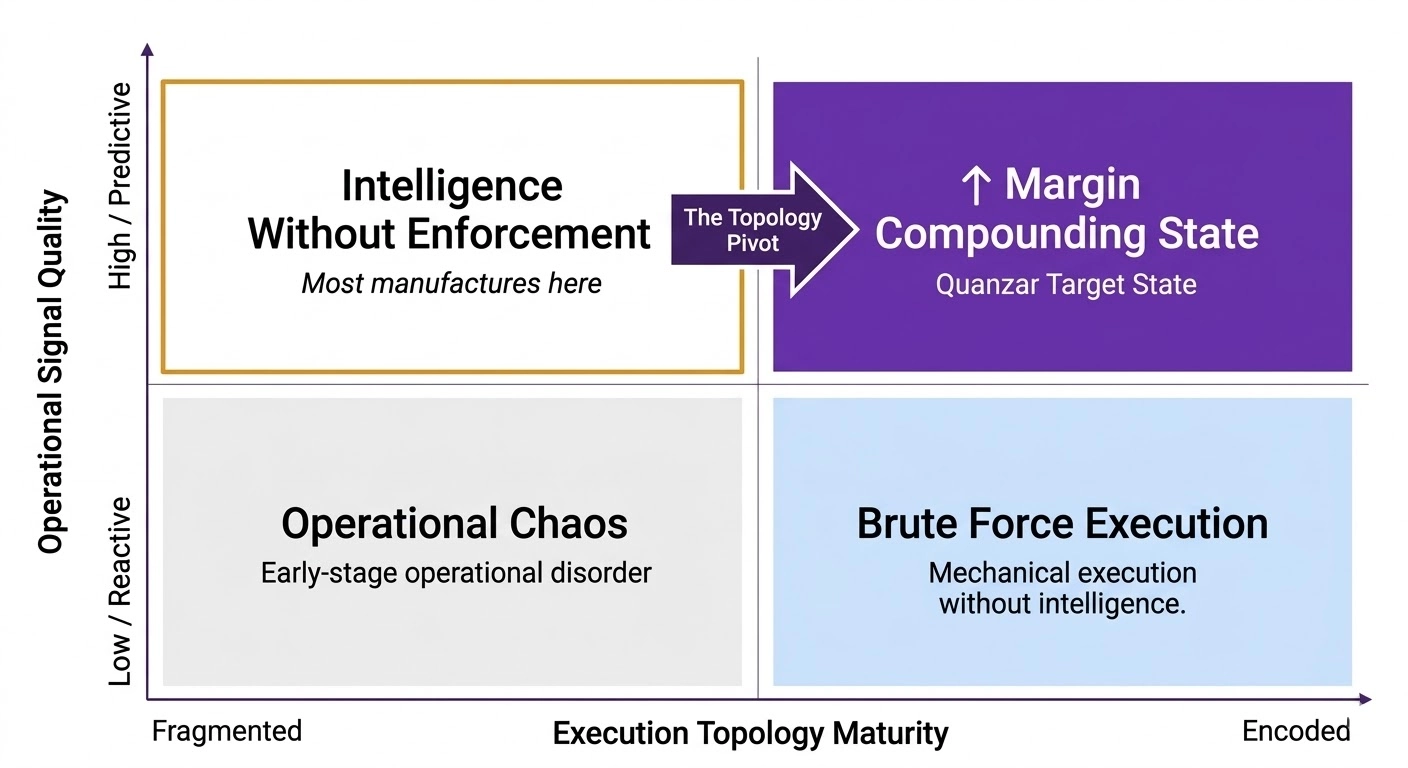
This gradual accumulation has a specific structural cause. Manufacturing operations on paper follow a linear topology: Sales → Planning → Procurement → Production → Quality Control → Engineering → Shipping. In practice, that topology is heavily fragmented. Work moves across these departments through email confirmations, verbal handoffs, Excel overrides, and undefined authority structures. When the topology is weak — when ownership is ambiguous, when escalation paths are unencoded, when authority is informal — margin leakage occurs precisely at the handoffs between departments. It is not visible in any single system. It is distributed across the white space between systems.
The financial consequence is particularly acute in manufacturing because of the industry's fundamental margin structure. With net profit margins averaging 7 to 12 percent of revenue, and material costs consuming approximately 42 percent of revenue, the financial buffer against operational waste is extremely thin. A 2 percent increase in rework, expedited freight, and inventory write-offs — the kind of increase that accumulates invisibly through topology failure — can eliminate 15 to 25 percent of a manufacturer's net profit in a single fiscal year without triggering any management alert.
Margin erosion is rarely a pricing problem. It is almost always an orchestration problem — and orchestration is a structural failure, not a personnel failure.
2. Why Thin Margins Magnify Topology Risk
To understand the structural stakes of topology failure in manufacturing, it is essential to internalize the arithmetic of thin margins. A manufacturer operating at 8 percent net margin — close to the industry average — retains $8 of profit for every $100 of revenue. Every dollar of operationally avoidable cost that is not eliminated reduces that margin by $1. A $50,000 shipment of expedited freight that proper signal routing would have prevented eliminates $50,000 of net margin — the equivalent of $625,000 in additional revenue that would have needed to be generated to restore the same profit position. This is the magnification effect of thin-margin operations: small operational failures have outsized financial consequences.
At an 8% net margin (manufacturing average), each dollar of avoidable operational waste requires $12.50 in additional revenue to restore the equivalent profit position. This is the structural amplifier that makes topology failure so financially dangerous.
This arithmetic explains why topology failures that appear modest in isolation — a $15,000 rework event here, a $30,000 expedited freight charge there — can devastate a manufacturer's annual profitability. The business did not lose a customer. It did not face a raw material price shock. The margin simply eroded through the gaps in its execution structure, one unencoded handoff at a time.
3. The Five Channels of Margin Leakage
Topology-driven margin leakage does not occur randomly. It concentrates in five structural voids that are present, to varying degrees, in every mid-sized manufacturing operation that has not encoded its execution layer. Identifying and closing each channel is the prerequisite for margin recovery.
Channel 1 — Undefined Process Ownership
When a defect occurs, production blames procurement, procurement blames forecasting, and QC blames production. Without encoded ownership — a systemic rule that assigns specific accountability to a named role at each workflow stage — variance events are written off as operational noise rather than corrected at the source. The defect recurs. The write-off accumulates. Without a real-time Margin Intelligence layer that ties each variance to a job, customer, and cost center, no one's system records who was responsible for the resolution — meaning the root cause is never structurally addressed and the cost repeats indefinitely.
Channel 2 — Late-Stage Risk Discovery
Supplier quality issues identified after shipment receipt. Material lead-time variances discovered on the day of scheduled production. Tooling failures identified during the production run rather than during pre-production checks. In every case, the financial consequence of late discovery is multiple orders of magnitude higher than the consequence of early detection. The cost difference between catching a supplier lead-time variance fourteen days early versus on the production day is the difference between a schedule adjustment and an expedited freight charge. Signal timing is entirely a structural variable — early warning is only possible when triggers are encoded and routed automatically, not when they depend on an individual remembering to check a spreadsheet.
Channel 3 — Unstructured Approval Logic
Critical approvals — production releases, supplier substitutions, engineering specification changes, overtime authorizations — occur through email replies or verbal confirmations. There is no systemic definition of what "approved" means, who has the authority to approve under what conditions, or what triggers escalation when an approval is not received within a defined window. Ambiguity in approval logic does not merely create administrative friction. It creates direct financial exposure: a production order released on a verbal "go-ahead" that later turns out to have referenced an obsolete engineering drawing generates rework costs, scrap, and potential customer delivery failure simultaneously. The approval system failed — not the people using it.
Channel 4 — Data Fragmentation Over Enforcement
Excel overrides the ERP. Machine downtime is logged but not attributed to a cost center. Quality control rejection data is not linked to the specific supplier lot that caused it. Financial data and operational data live in disconnected systems, maintained by different teams with different priorities. In this environment, data visibility does not produce operational control — it produces reporting about failures after they have already consumed margin. Quanzar's Margin Intelligence architecture connects ERP, CRM, and finance data into a single live view, where job-level margin writes to the dashboard automatically — not at month-end when the damage is already done.
Channel 5 — Write-Off Culture
Inventory shrinkage, scrap accumulation, and expedited freight charges are categorized broadly as "operational variance" and accepted as a permanent cost of doing business. Once variance is normalized, margin erosion becomes invisible — it is no longer tracked as a correctable failure but accepted as an environmental condition. This cultural shift is itself a structural symptom: when no system forces root-cause attribution for write-offs, the organization loses the mechanism by which it could detect and close leakage channels. Every expedited freight charge, every scrapped component, and every inventory write-off should carry a mandatory root-cause code that is permanently logged to the relevant job and cost history. Without that enforcement, variance accumulates without limit.
4. Why ERP Cannot Prevent Topology Failure
The most common executive response to escalating operational variance is to invest in a new or upgraded ERP system. The expectation is that better reporting, tighter transaction recording, and more integrated data will reduce the variance and stabilize the margin. This expectation is structurally incorrect.
ERP systems serve a specific and valuable purpose: they record transactions, maintain accounting traces, and produce operational reports. They observe outcomes. They show what happened. What they do not do — and what they were architecturally never designed to do — is enforce cross-department escalation, route risk signals to the appropriate authority tier, or lock downstream workflows when upstream conditions change. An ERP tells you that expedited freight cost $48,000 last month. It does not prevent the conditions that made that charge inevitable from recurring this month.
What ERP Provides
Transaction recording and accounting trace. Inventory balance visibility. Purchase order and work order history. Reporting on outcomes that have already occurred. Retrospective financial analysis by period, cost center, and category.
What Margin Intelligence Provides
Real-time job margin visibility the moment a job drifts below target. Automatic alerts to the right people before the month closes. Customer margin trending that surfaces account drift months before revenue drops. Rep-level performance data that shows where pricing guidance is needed — not where it failed.
The distinction is between a ledger and an enforcement layer. To prevent margin leakage rather than merely record it, manufacturers need Margin Intelligence that operates as a structural layer above the ERP — intercepting variance events before they write to the ledger as costs, alerting decision-makers while jobs are still open and fixable, and generating a clear picture of every job, customer, and rep that is contributing to margin erosion in real time.
This is not a criticism of ERP technology. Enterprise resource planning systems do precisely what they were designed to do. The architectural gap is that most manufacturing organizations stop at the ERP layer and assume it constitutes a complete operational control environment. It does not. The ERP is the accounting system. Margin intelligence is the operational governance layer. Both are required — they are not substitutes for each other.
5. Signal Timing and the Financial Cost of Late Discovery
Across all five channels of margin leakage, a single variable determines the magnitude of the financial consequence: the timing of the signal. The same underlying operational event — a supplier lead-time variance, a material quality deviation, a job priced below threshold — generates radically different financial outcomes depending on when it is detected and when it triggers an operational response.
This relationship is not linear. The financial consequence of late signal detection does not merely increase proportionally with delay — it compounds. A lead-time variance detected fourteen days before the scheduled production run allows a schedule adjustment at near-zero cost. The same variance detected on the morning of production requires expedited freight, overtime labor for a shifted schedule, and potentially a customer delivery delay that carries contractual penalties. The underlying supply chain event is identical. The financial outcome differs by a factor of ten to twenty, determined entirely by when the signal was routed to a decision-maker with the authority to act.
Scenario: Supplier Lead-Time Variance Detected 14 Days Early
A margin alert fires when projected job cost drifts against schedule. Procurement is notified with the specific gap in dollars, not just a percentage. Alternate sourcing is initiated from the pre-approved vendor list. Production schedule is adjusted within a 6-hour window with no downstream impact.
Same Scenario: Variance Discovered Morning of Production Run
A buyer notices the material has not arrived when the production line starts. Email chain begins. Expedited freight is authorized verbally after a 2-hour delay. Overtime is approved for a shifted run. Customer delivery is delayed by 3 days, triggering a contractual notice requirement and relationship friction.
The operational scenario in both cases is identical — a supplier missed a lead time. The financial consequence differs by a factor of 10 to 20. The only variable that changed is signal timing, which is entirely a function of whether the organization has encoded early warning triggers into its margin layer or relies on individual operators to notice problems during routine checks.
Deloitte's 2025 Manufacturing Industry Outlook confirms that manufacturers who invest in supply chain digitization and planning software — particularly tools that embed automated signals into decision workflows — consistently outperform peers on cost stability and margin predictability. The investment case is not in the technology itself; it is in the signal timing advantage that margin intelligence creates over manual monitoring systems.
6. Engineering Change as a Risk Multiplier
Engineering Change Requests (ECRs) represent one of the highest-risk workflows in mid-manufacturing operations, and one of the most structurally under-governed. When an engineering specification changes — whether due to a design revision, a customer requirement update, a supplier material substitution, or a regulatory compliance update — the change must propagate accurately and completely across planning, procurement, production, and quality systems before any production activity proceeds.
In organizations without encoded ECR routing, this propagation occurs through email distribution lists, update calls, and document version management that depends on individuals remembering to check for current revisions before committing materials or labor. The consequences of an ECR failure are not speculative — they are well-documented across manufacturing litigation, quality audit findings, and field return events. Work-in-process material that cannot be reworked must be scrapped. Components procured against an obsolete specification must be credited or disposed of. Production labor applied against superseded drawings must be entirely redone. In complex assemblies, a single ECR failure can generate write-off events across three to five cost categories simultaneously.
The financial exposure is compounded by timing: ECR failures are typically discovered during production or at final inspection — the latest possible point in the value chain, when the maximum labor and material value has already been committed to the work order. Earlier detection at any stage would have reduced the write-off proportionally. Execution-bound ECR routing eliminates this risk by structurally preventing any production activity from proceeding while affected work orders are in an unresolved change state.
{
  "workflow": "ECR_Implementation_Gate",
  "trigger": "engineering_release_event",
  "routing_gates": [
    {
      "gate": "wip_inventory_check",
      "action": "halt_affected_production_orders",
      "condition": "existing_WIP > 0",
      "workflow_lock": true,
      "assigned_owner": "Production_Planner_ID"
    },
    {
      "gate": "procurement_alignment",
      "action": "trigger_supplier_specification_update",
      "sla_requirement": "24_hours",
      "escalation_path": "Procurement_Director"
    },
    {
      "gate": "financial_impact_review",
      "action": "force_cost_delta_authorization",
      "required_approval_tier": "CFO_threshold_check"
    }
  ],
  "financial_enforcement": {
    "lock_variance_code": true,
    "scrap_write_off_requires_justification": true,
    "margin_impact_logged_to_job": true
  }
}
This architecture enforces a structural prerequisite: before any production order proceeds against a revised specification, the system requires verified sign-off across inventory impact, procurement alignment, and financial authorization — each with a defined SLA and an automatic escalation path if the SLA is breached. An ECR cannot be implemented informally by a single engineer sending a revised drawing to the shop floor. The system enforces compliance at every gate, and every write-off triggered by an ECR failure is attributed back to the job and cost center in real time.
7. The Quanzar Structural Approach: From Leakage to Recovery
Margin recovery in manufacturing requires three structural interventions applied in sequence: process ownership encoding, real-time job margin visibility, and customer-level drift detection. These are not independent improvements that can be implemented in isolation — they form a connected architecture in which each layer reinforces the others. Ownership encoding without visibility produces accountability without measurement. Visibility without customer-level trending produces job-by-job reactions without strategic pattern detection. All three layers are required for the architecture to close leakage channels permanently rather than temporarily.
Quanzar's product suite addresses these layers in sequence: the Margin Intelligence Dashboard provides live job, customer, and rep margin visibility; the Revenue Leak Tracker extends that visibility to account-level drift and silent churn; and the AI Ops Layer automates the workflows triggered by margin alerts — ensuring the right people act on signals while they still can.
The table below compares operational outcomes in unstructured (topology-failed) environments against those achieved through margin intelligence implementation. Improvement ranges are based on documented outcomes from Quanzar pilot engagements; individual outcomes vary by organization size, complexity, and baseline state.
| Operational Metric | Legacy State — Unstructured | With Margin Intelligence | Improvement Range |
|---|---|---|---|
| Production Downtime | Reactive material shortages discovered on production day | Real-time job alerts — cost drift flagged while still actionable | 18–25% reduction |
| Rework Cycles | Ambiguous version control ECRs via email | Structured ECR enforcement — production locked until aligned | 15–20% reduction |
| Expedited Freight | Same-day discovery — no advance signal routing | Early-stage job alerts — alternate sourcing before crisis | 15–22% reduction |
| Inventory Write-offs | Manual overrides — shrink normalized as variance | Cross-system validation — write-off requires root-cause attribution | 12–18% reduction |
| ECR Scrap Events | Change propagated via email — WIP regularly scrapped | Execution-bound ECR gates — production locked during change | Structural elimination |
| Gross Margin | Gradual invisible compression — baseline erodes year-on-year | Stable, compounding efficiency — leakage channels closed | 5–9% improvement |
8. Six Actionable Interventions for Operational Leaders
The following six interventions are sequenced in order of structural dependency — each one builds the foundation for the next. They are not independent improvement initiatives; they are the components of a unified margin recovery architecture. Organizations that implement them selectively rather than systematically will achieve partial improvement but will not close the leakage channels permanently.
01 — Run a Margin Leak Audit
Start with data from your last 5–15 jobs. Compare quoted margin against realized margin by job, customer, and sales rep. The gap tells you where topology is failing before you invest in any system change. Quanzar's free margin audit produces a one-page report in under 10 minutes, including estimated annual leakage and jobs flagged for immediate review.
02 — Connect Real-Time Job Margin Visibility
Stop finding out at month-end. Implement Margin Intelligence that alerts you the moment a job drifts below your target margin — while the job is still open and the damage is still correctable. Alerts must include the dollar impact, not just a percentage, to make the urgency real to the right decision-maker.
03 — Augment the ERP, Not Replace It
Stop expecting the ERP to manage cross-departmental execution. Build a margin intelligence layer above the ERP that handles signal routing, customer trending, and rep-level analysis — feeding clean, validated margin data into the ERP rather than asking the ERP to prevent the bad decisions in the first place.
04 — Track Customer Margin Drift Before Revenue Drops
Use Revenue Leak Tracker to surface accounts that are quietly drifting below margin target. Most manufacturers find out a key account drifted six months after it happened. Customer margin trending tells you while there is still time to have a pricing conversation — before the revenue impact compounds.
05 — Accelerate Signal Timing Across the Supply Chain
Encode early-warning triggers at the point of supply chain event occurrence, not at the point of production impact. A supplier lead-time deviation flagged the day the supplier confirms the delay costs near zero to resolve. The same deviation discovered when the material does not arrive is a crisis with a four-figure minimum cost. Signal timing is entirely a structural variable.
06 — Automate the Workflows That Kill Response Speed
Deploy the AI Ops Layer to automate the routine workflows triggered by margin alerts: email summaries to the right people, task creation with defined SLAs, escalation if alerts go unresolved. Your team handles the exceptions. AI handles the rest — with a full audit trail and human approval before any external communication is sent.
9. Strategic Conclusion
Mid-sized manufacturers rarely suffer from insufficient effort. Plants operate. Teams work overtime. Procurement chases down suppliers. QC retests components. The effort is genuine and continuous. Yet margin continues to compress — not because the people are failing, but because the topology through which their effort flows is structurally incapable of preserving the value that their effort generates.
Margin erosion is almost never a pricing problem. Customers have not reduced their willingness to pay. Materials have not uniformly become more expensive. The market has not moved against the business in any single, identifiable way. The margin has eroded through the gaps in the execution structure — through handoffs that lack encoded ownership, approvals that occur through email, change orders that reach the shop floor without a financial impact review, and signals that arrive too late to permit any mitigation. These are structural failures, not personnel failures, and they require structural remedies.
The remedy is not a new ERP. It is not additional headcount. It is not a culture change initiative. It is the systematic encoding of operational logic into a governed margin intelligence environment: job-level visibility connected to the right people in real time, customer drift detected months before revenue impact, rep-level performance understood through realized margin rather than volume, and every alert routed to someone with the authority and the window to act. When the topology is stabilized, the margin compounds. The throughput increases without additional capital expenditure. The expedited freight disappears without supplier contract revisions.
Fix the topology. The margin will follow.
Stop the Margin Bleed.
Find out exactly where your operational topology is failing and what it is costing you — job by job, customer by customer. The audit takes 10 minutes. The results are in real dollars before you commit to anything.
Free · No sales call · Results in under 10 minutes
References & Data Sources
- Damodaran, A. (January 2026). Operating and Net Margins by Sector. NYU Stern School of Business. Manufacturing sector net margins. Available: pages.stern.nyu.edu.
- ProjectionHub / IRS Data. 10 Manufacturing Industry Financial Statistics. Based on IRS tax return analysis of 386,484 manufacturing sole proprietors. Key finding: average manufacturing expenses equal 92% of total revenue; material costs average 42% of revenue. Available: projectionhub.com.
- Deloitte. (November 2024). 2025 Manufacturing Industry Outlook. QuantumBlack / Deloitte Insights. Key findings: 55% of industrial manufacturers leveraging gen AI; 78% of AI initiatives tied to digital transformation strategy; only 51.6% have a formal AI strategy. Available: deloitte.com/us/en/insights.
- Manufacturing Leadership Council. (2024). Survey of 78% of manufacturers with AI as part of digital transformation strategy. Cited in Deloitte 2025 Manufacturing Industry Outlook.
- Deloitte. (2024). Future of the Digital Customer Experience. 55% of industrial product manufacturers leveraging gen AI tools in operations.
- Vena Solutions. (February 2025). Industry Benchmarks of Gross, Net and Operating Profit Margins. Gross margin for auto manufacturing cited at 12.45%; general manufacturing sector analysis. Available: venasolutions.com.
- Manufacturing Dive / Owens, N., Samora, S., Rosengren, C. (December 23, 2025). "By the numbers: 2025 manufacturing trends." ISM survey data: 48% of manufacturers piloting AI supply chain applications. Available: manufacturingdive.com.
- Quanzar Technologies. (2026). Margin Intelligence Dashboard. Product documentation and pilot engagement outcomes. Available: quanzar.com/margin-intelligence.
- Quanzar Technologies. (2026). AI Ops Layer. Available: quanzar.com/ai-ops-layer.
- Quanzar Technologies. (2026). Revenue Leak Tracker. Available: quanzar.com/revenue-leak-tracker.
- Quanzar Technologies. (2026). Quote Intelligence. Available: quanzar.com/quote-intelligence.
Note on improvement ranges: Metric improvement ranges cited in Exhibit 4 and the comparison table represent documented outcome archetypes drawn from Quanzar's pilot engagement portfolio with contract manufacturers, and are consistent with publicly available lean manufacturing and workflow automation benchmarks. They are directional indicators, not contractual performance guarantees, and should be evaluated in the context of each organization's specific operational baseline.