SaaS Proliferation and the Illusion of Digital Maturity:
Why Software Accumulation Is Not Operational Intelligence
Organizations have purchased their way into digital complexity without purchasing their way into operational capability. This whitepaper examines the structural gap between software density and execution authority — and defines what orchestration, not accumulation, actually requires for manufacturing operations.
Across manufacturing, contract fabrication, semiconductor distribution, aerospace supply chains, and regulated industries, organizations have made aggressive and sustained investments in digital tools. They operate ERP systems, MES platforms, procurement SaaS, quality management software, BI dashboards, and AI forecasting models simultaneously. Their software portfolios have expanded from an average of 16 applications in 2017 to 106 in 2024. From a surface view, these organizations appear digitally advanced — even digitally mature. Yet operational instability persists, margin erodes, digital transformation projects fail at a 70 percent rate, and the average large enterprise loses $104 million annually to digital inefficiencies it cannot see or measure. The root cause is not a lack of technological tools. It is a fundamental, structural absence of orchestration — the architectural layer that governs how work moves, how authority is assigned, and how insight is converted into enforced operational action across all those systems simultaneously.
1. The Digital Maturity Illusion Defined
Digital maturity is one of the most consistently misdiagnosed conditions in enterprise operations. It is measured, almost universally, by what an organization has purchased: the ERP implementation, the cloud migration, the AI pilot, the BI dashboard rollout, the procurement SaaS subscription. Technology investments serve as proxies for capability — and in boardroom presentations, the density of the software stack becomes evidence of competitive readiness.
The research does not support this framing. BCG's analysis of 850 companies found that only 35 percent of digital transformation initiatives meet their stated value targets. Bain's 2024 study is more direct: 88 percent of business transformations fail to achieve their original ambitions. Gartner's survey found that only 48 percent of transformation projects fully meet or exceed their goals. The global spend on digital transformation is projected to reach $3.4 trillion by 2026. The return on that investment, by any rigorous independent measure, is predominantly negative.
The explanation for this paradox is architectural. Organizations have funded the acquisition of tools. They have not funded the encoding of the operational logic that governs how those tools work together, how authority flows between them, and how exceptions, escalations, and approvals are enforced across system boundaries. Software capability without execution architecture produces exactly what the research documents: expensive, visible, well-publicized digital programs that fail to change operational outcomes.
Digital maturity is not measured in the number of systems deployed. It is measured in the percentage of critical operational decisions that are enforced by the system rather than negotiated through email.
2. The SaaS Proliferation Data: What Has Actually Been Built
The scale of enterprise SaaS accumulation over the past decade is documented with precision by multiple independent research bodies. The data is striking — not because it reveals catastrophic waste (the tools themselves generally perform their stated functions) — but because it reveals the structural complexity that has been created without any accompanying investment in the governance layer required to orchestrate it.
Average number of SaaS applications deployed per company, across all organization sizes. Growth from 2017 to 2022 was continuous; consolidation pressure began in 2023. The absolute number remains dramatically higher than a decade ago — and the integration and governance complexity has not declined proportionally.
Beyond the headline number, the distribution data reveals the governance challenge more precisely. Mid-sized companies — those with 200 to 749 employees — use an average of 96 SaaS applications. Large enterprises with over 5,000 employees average 131. Critically, 84% of those applications and 74% of SaaS spending operate entirely outside IT's direct governance responsibility, according to Zylo's 2025 SaaS Management Index. The average large enterprise believes it uses 37 applications. It actually uses 625 — including more than 170 AI applications — per WalkMe's 2025 study of enterprise digital adoption.
The financial consequence of this unmanaged complexity is direct and measurable. WalkMe's March 2025 research found that the average large enterprise lost $104 million to digital inefficiencies in 2024, driven primarily by employees losing an average of 36 workdays annually navigating IT roadblocks and switching between disconnected systems. Companies waste an average of $135,000 annually on unused or redundant SaaS licenses alone, per BetterCloud and Zylo. Shadow IT — the unsanctioned applications employees adopt independently when official tools fail them — now accounts for 30 to 40 percent of total IT spending in large organizations, according to Gartner.
The pattern is consistent: software investment is high, software governance is low, and the gap between the two is filled by employee-invented workarounds that operate outside any governance structure whatsoever.
3. The Multi-System Fragmentation Model: What the Stack Actually Looks Like
Most organizations expand their software portfolios in distinct, siloed phases driven by departmental needs rather than enterprise architecture. Finance requests a new ERP module. Production needs a manufacturing execution system. Quality requires a standalone QMS. Sales implements its own CRM. Engineering adds a PLM. IT installs a BI platform. Each acquisition solves a department-level problem. None of them addresses — and each of them compounds — the cross-department execution problem.
The result is a technology stack that performs individual functions effectively but lacks any structural layer governing cross-system execution logic. Each platform connects to others through API integrations or scheduled data exports. But data connectivity is not execution authority. Knowing that the ERP says "financially cleared" and the QMS says "quality verified" simultaneously does not automatically release the production order in the MES. A human must read both systems, confirm both statuses, and manually trigger the next action — reintroducing the manual consensus problem that every software investment was supposed to eliminate.
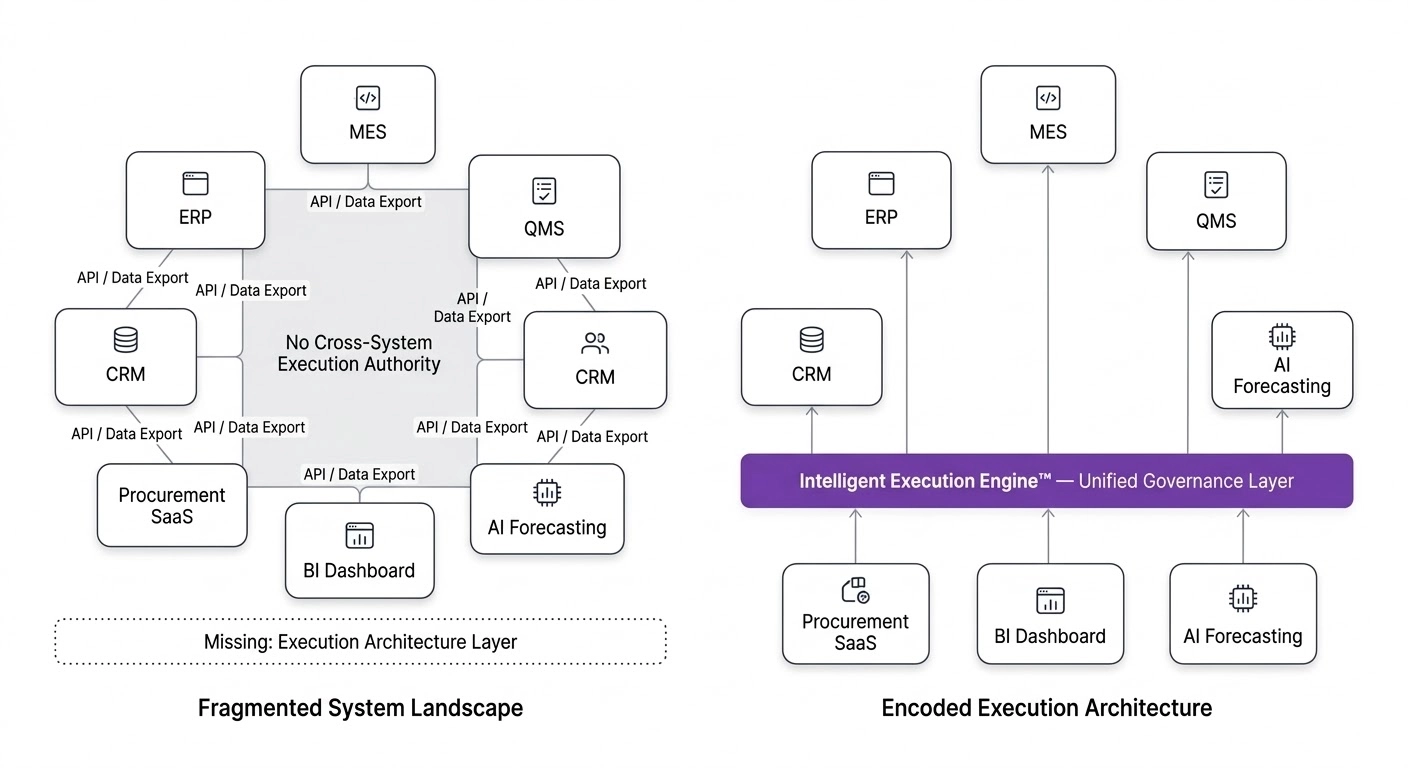
4. Shadow Governance: Email, Excel, and the Shadow IT Economy
In the absence of an encoded cross-system execution layer, organizations do not remain ungoverned. They invent informal governance structures that fill the authority gap. These structures are primarily executed through three channels: email, Excel, and unsanctioned applications — what we collectively term Shadow Governance.
The Email Authority Problem
When critical operational confirmations — production releases, supplier substitutions, engineering specification changes, margin overrides, purchasing authorizations — travel through email, the organization has structurally replaced its governance architecture with a communication tool. Email provides none of the properties that governance requires: it has no defined authority hierarchy, no SLA enforcement, no automatic escalation, no immutable audit trail, no version control, and no workflow lock that prevents action when a required approval has not been received. An email reply that says "looks good, go ahead" is not a governed approval — it is an undated, unattributed, version-unspecified verbal instruction in a digital medium.
The legal and regulatory exposure of email-based approval systems is substantial. In regulated industries — aerospace, pharmaceutical manufacturing, medical device production — an approval that cannot be attributed to a specific authorized individual with a verified timestamp and a documented authority level is not an approval at all. It is an audit finding waiting to be discovered.
The Excel Override Problem
Excel overrides represent the second pillar of Shadow Governance. When an ERP forecast produces an unacceptable output, an analyst exports the data, applies a manual adjustment, and emails the revised file to a decision-maker. The decision is made against the Excel version, not the ERP version. The ERP is then updated manually to reflect the decision — introducing a version control gap between the analytical basis for the decision and the system of record for its outcome. Over time, organizations develop entire operational processes that exist in Excel files maintained by individuals whose departure would render the process unrecoverable. In manufacturing, this pattern is directly responsible for the quoted-vs.-realized margin gap: jobs are priced in a spreadsheet against gut feel, not against the historical cost data that already exists in the ERP.
The Shadow IT Explosion
The third pillar is the most rapidly growing and the most structurally dangerous. When official enterprise tools fail to meet employee workflow needs, employees adopt unsanctioned applications independently. This is the Shadow IT economy — and its scale is no longer marginal. Gartner documents that shadow IT accounts for 30 to 40 percent of IT spending in large enterprises. IBM's 2024 Cost of a Data Breach Report found that one in three enterprise data breaches now originates from a shadow IT application, at an average cost of $4.88 million per incident. Forrester predicted 60 percent of employees would adopt AI tools without IT approval in 2024 — and Microsoft's 2024 Work Trend Index found that 78 to 80 percent of workers were already using personal AI tools for work tasks, most without IT awareness.
Email-Based Approvals
Critical authorizations — purchasing, release, specification changes — transmitted and "confirmed" via email reply with no authority attribution, no SLA enforcement, and no audit trail beyond the inbox.
Excel Override Files
Operational decisions — including job quoting and margin estimates — made against analyst-maintained spreadsheets that shadow the ERP, creating version drift between the analytical record and the system of record.
Unsanctioned SaaS (Shadow IT)
30–40% of enterprise IT spending occurs in unsanctioned applications. 48% of enterprise apps are unmanaged. Average large enterprise uses 625 apps while believing it uses 37. (Gartner / WalkMe 2025)
Shadow AI Usage
78–80% of workers use personal AI tools at work without IT oversight. Shadow AI caused security breaches at 20% of organizations in 2024, with additional breach costs of $670,000 per incident. (Microsoft / IBM 2025)
Annual Cost of Digital Inefficiency
$104M average loss per large enterprise from digital inefficiencies. Employees lose 36 workdays annually to IT friction. $135,000 wasted per company in unused SaaS licenses. (WalkMe March 2025 / BetterCloud)
The aggregate picture is clear: enterprises have built expansive digital stacks that are simultaneously under-integrated at the governance layer and over-extended at the informal workaround layer. The tools are present. The structure is absent. Employees fill the structural gap with personal productivity tools and informal approval chains — and in doing so, create security exposures, audit vulnerabilities, and operational risks that the official software investment was intended to eliminate.
5. The Definition Gap and the Fatal Wounding of AI Initiatives
As enterprises layer AI tools onto fragmented SaaS environments, they encounter a structural problem that is rarely diagnosed correctly: the Definition Gap. In fragmented multi-system environments, terminology drifts. The same operational terms carry materially different meanings across different platforms, populated and maintained by different departments with different operational objectives.
When three systems simultaneously report "Approved" against the same production order — but each definition refers to a different operational condition — no single system reflects the composite readiness state of the operation. A production release that satisfies the ERP's definition of approved while the QMS holds an unresolved quality flag will generate a rework event — not because the systems failed, but because no structural layer exists to synthesize their independent definitions into a unified, binding readiness determination.
This Definition Gap directly and fatally undermines AI initiatives. Organizations deploy predictive forecasting models, anomaly detection systems, and demand intelligence tools onto these fragmented environments. The models generate alerts. But the alerts reference system states that mean different things to different departments. The alert routes to a BI dashboard, a manager interprets it against their department's definition of the flagged term, a decision is delayed while competing interpretations are debated, an email confirmation is issued, and an Excel sheet is updated manually. The AI has not accelerated a decision. It has created a new forum for the same manual consensus debate that it was deployed to eliminate.
Without Terminology Discipline — the encoding of shared definitional constants that every system layer reads identically — AI tools cannot function as execution systems. They remain advisory instruments in an environment where the advisory signal cannot be structurally routed to an authority that can act on it without ambiguity. This is precisely why Quanzar's Margin Intelligence approach encodes a single shared definition of margin — quoted vs. realized, by job, customer, and rep — into a unified view that every stakeholder reads from the same source, not from competing spreadsheets.
{
  "orchestration_layer": "Margin_Intelligence_Gate",
  "version": "2.0.0",
  "term_enforcement": {
    "composite_status": "Job_Margin_Healthy",
    "required_conditions": [
      { "source": "ERP",     "field": "realized_margin_pct",   "threshold": ">= quoted_target" },
      { "source": "CRM",     "field": "customer_order_frequency", "threshold": "within_normal_range" },
      { "source": "Finance", "field": "invoice_vs_quote_delta",  "threshold": "< 3_percent" }
    ],
    "all_conditions_required": true,
    "any_breach_triggers_alert": true
  },
  "alert_routing": {
    "primary_owner": "VP_Operations",
    "secondary_owner": "Controller",
    "channels": ["email", "slack"],
    "sla_hours": 4,
    "escalation_on_breach": "COO_queue"
  },
  "governance": {
    "dollar_impact_included_in_alert": true,
    "immutable_log_on_alert_fire": true,
    "override_requires_justification": true
  }
}
This architecture enforces a composite margin health condition. "Healthy" is not a single system's status — it is the verified intersection of three independent data sources, each attributed to a named stakeholder. The AI alert is not advisory; it fires to the right person with the dollar impact included, within a defined SLA window, with automatic escalation if the window expires. Terminology ambiguity is structurally eliminated — not culturally encouraged.
6. Dashboard Culture vs. Decision Culture: The Observation-Action Gap
One of the most persistent misconceptions in enterprise digital strategy is the equation of visibility with control. A BI dashboard that displays real-time inventory levels does not prevent those inventory levels from reaching crisis thresholds. An AI forecasting model that accurately projects a demand spike does not trigger the procurement action required to service that demand. A margin dashboard that shows a job drifting 15 points below target does not close the margin gap — unless that alert fires to the right person, while the job is still open, with the dollar impact stated clearly enough to compel action.
Dashboards observe operational states. Architecture enforces operational responses. These are structurally different capabilities, and confusing them is the single most consistent cause of the digital transformation failure rate documented by BCG, McKinsey, and Bain. Organizations invest in observation tools and expect control outcomes. When the control outcomes do not materialize — when inventory still fluctuates despite the BI investment, when margin still erodes despite the AI forecasting deployment — the response is typically to invest in better observation tools. The actual deficit, consistently, is in the enforcement layer.
The transition from dashboard culture to decision culture does not require replacing the dashboards — the BI investment has genuine value as a reporting and analytical layer. It requires building the enforcement layer that converts dashboard observations into system-enforced actions. Quanzar's Margin Intelligence Dashboard is built precisely around this distinction: alerts fire while jobs are still open and fixable, include the dollar impact in the notification, route to the right person via email and Slack, and carry a configurable SLA before automatic escalation. The AI Ops Layer then automates the follow-on workflows — task creation, rep notification, re-engagement outreach — so that alerts don't age out silently in someone's inbox.
7. The Orchestration Architecture: What Genuine Digital Maturity Requires
Digital transformation that produces operational outcomes — not merely digital complexity — requires a specific architectural component that most enterprises have not built: a margin intelligence layer that sits above the existing software portfolio and governs cross-system execution logic. This is not an additional SaaS application purchased for its own sake. It is a structural governance environment that encodes authority, enforces decisions, and eliminates the informal workarounds that currently fill the space between systems.
Quanzar's Margin Intelligence suite operates as precisely this layer for manufacturing operations. Rather than replacing the ERP, MES, QMS, or CRM that organizations have already invested in, it governs the execution spaces between them — the handoffs, approvals, escalations, and authority transfers that currently occur through email, Excel, and Shadow IT — and surfaces the margin consequences of those gaps in real time, by job, by customer, and by rep.
What the Existing Stack Continues to Do
ERP records transactions and financial data. MES governs shop floor execution within production. QMS tracks quality events and CAPA workflows. CRM manages customer and supplier relationships. BI provides reporting and analytical visualization. None of these change. Quanzar connects to them — read-only — without rip-and-replace. Works with P21, NetSuite, SAP, and Epicor.
What the Margin Intelligence Layer Adds
Live job margin visibility — quoted vs. realized, updated as jobs progress. Customer margin trending that surfaces account drift before revenue drops. Rep-level performance that shows where pricing guidance is needed. Alerts that fire to the right person with the dollar impact while jobs are still open. AI Ops automation that handles the follow-on workflows so alerts don't die in an inbox.
Critically, the orchestration layer resolves the four structural failures that make software accumulation operationally ineffective:
- Shared Margin Definition — a single, consistent view of quoted vs. realized margin that every stakeholder reads from the same source, eliminating the competing spreadsheet interpretations that delay decisions
- Alert Enforcement — hard structural alerts that fire while jobs are still open, not post-mortems delivered at month-end when the damage is already spent
- Automated Escalation — threshold-triggered routing via the AI Ops Layer that does not depend on individual initiative or anyone remembering to follow up
- Revenue Attribution Trace — a clear record of every job, customer, and rep contributing to margin performance, from the Revenue Leak Tracker, that makes account drift visible months before it shows in the P&L
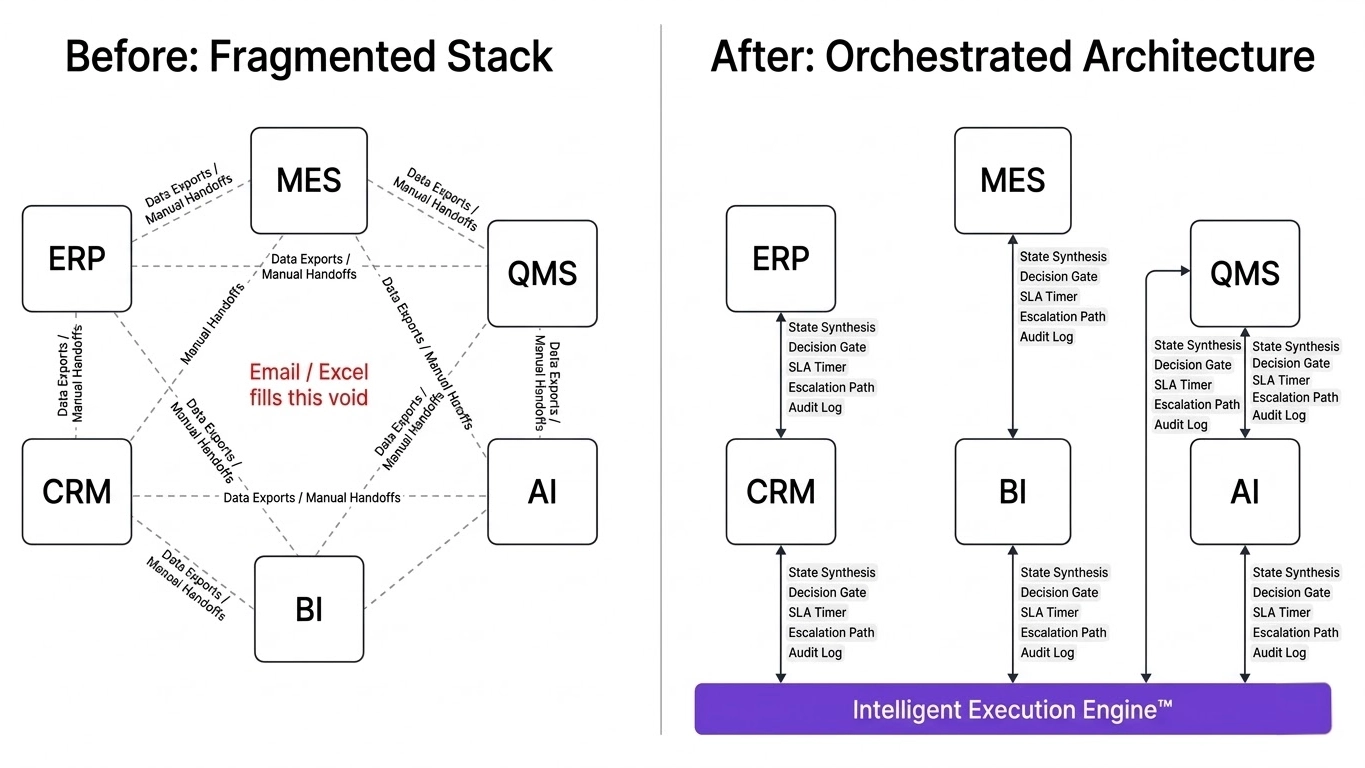
8. Measurable Impact of Execution Orchestration
When organizations stop acquiring additional SaaS tools and instead implement a margin intelligence layer above their existing stack, the financial and operational impacts are immediate, measurable, and structurally durable — because they address the cause of operational instability rather than adding another observation system to report on it.
| Operational Metric | Pre-Orchestration State | Post-Orchestration State | Impact Range |
|---|---|---|---|
| Email-Based Approvals | Majority of cross-dept. authorizations | Structurally eliminated — approvals in system gates | 60–80% reduction |
| Excel Override Files | Shadow ERP for quoting and margin decisions | Historical data from ERP surfaces in Quote Intelligence automatically | 50–70% reduction |
| Quote Accuracy | Gut-feel pricing — 22% of jobs below target margin | Historical comp lookup — 6.2pt avg margin improvement per job | 6+ point improvement |
| Margin Discovery Timing | Month-end P&L — damage already spent | Real-time alert — job still open, still fixable | Weeks earlier |
| Customer Drift Detection | Discovered 5–6 months after drift begins | Revenue Leak Tracker flags at month 1 of drift | Structural elimination of late discovery |
| Audit Readiness | Reconstructed from email threads — unreliable | Immutable, authority-attributed, timestamped record | Governance-ready by default |
| AI Initiative ROI | Advisory only — no binding execution path | AI Ops Layer automates follow-on workflows from every alert | Measurable P&L impact |
Organizations that invest in software without investing in orchestration achieve high digital complexity with low operational performance. The margin intelligence investment — typically a fraction of total software spend — disproportionately closes the gap.
9. Six Structural Interventions for Manufacturing Leaders
The following interventions are sequenced in structural dependency order. They are not independent digital initiatives — they are the components of a unified margin orchestration architecture. Implementing them selectively will achieve partial improvement. Implementing them systematically closes the operational gaps that software accumulation cannot close.
01 — Audit Your Margin Before Adding Another Tool
Stop buying software to solve a problem you haven't yet measured. Run a free margin audit against your last 5–15 jobs. See exactly which jobs bled margin, which customers are drifting, and how much is recoverable. That number — in real dollars — tells you where to invest next. The audit takes 10 minutes and produces a one-page PDF with a red/amber/green health score.
02 — Eliminate Excel as Your Quoting System
If jobs are being priced on gut feel or a manually maintained spreadsheet, the quoted-vs.-realized gap is structural, not coincidental. Replace the spreadsheet with Quote Intelligence — which pulls historical job cost data from your ERP, surfaces comparable jobs, and generates a margin suggestion with a confidence score. The data already exists in your ERP. The engine just makes it accessible in seconds instead of hours.
03 — Connect Real-Time Job Margin Visibility
Stop finding out at month-end. Implement Margin Intelligence that alerts the right person the moment a job drifts below your target margin — while the job is still open and the damage is still correctable. Every alert must include the dollar impact, not just a percentage, and must route to someone with the authority and the window to act.
04 — Bind AI Alerts to Action, Not Observation
An alert that fires to a dashboard no one checks is not an AI investment — it is a reporting tool with extra steps. Use the AI Ops Layer to automate the workflows triggered by every margin alert: email summary to the VP and Controller, task created in the project tracker, 48-hour resolution timer started. The alert fires. The workflow executes. Your team handles the exception. AI handles the rest — with a full audit trail.
05 — Track Customer Drift Before It Becomes Revenue Loss
Silent customer churn in manufacturing follows a predictable pattern: order frequency drops, then order size drops, then margin drops. By the time it shows in the revenue report, it is six months old and the relationship is already cold. Deploy Revenue Leak Tracker to surface customer health signals in week one of drift — while there is still time for a pricing conversation rather than a post-mortem.
06 — Build the Intelligence Layer Above the Existing Stack
Do not replace the ERP. Do not replace the CRM. Connect Quanzar's margin intelligence suite as a read-only layer above your existing systems — P21, NetSuite, SAP, Epicor, and others. The intelligence investment preserves the existing software investment while delivering the operational governance that software investment alone cannot provide. This is the architecture that converts software accumulation into operational performance.
10. Strategic Conclusion
The enterprise software investment over the past decade has been, by any financial measure, enormous. The digital transformation market is projected to reach $3.4 trillion by 2026. Organizations have purchased ERP systems, MES platforms, quality management tools, AI forecasting models, and BI dashboards in every combination. They have migrated to the cloud, integrated APIs, and deployed machine learning models with impressive technical sophistication.
The research outcome is nonetheless consistent: 70 percent of digital transformation initiatives fail to meet stated objectives. The average large enterprise loses $104 million annually to digital inefficiencies. Bain found that 88 percent of business transformations fail to achieve their original ambitions. The software is present. The operational intelligence is absent.
The explanation is structural. Software provides capability. Architecture provides authority. AI provides insight. Only execution topology produces performance. Organizations that purchase 106 SaaS applications but invest nothing in the orchestration layer that governs how those applications interact — how authority flows between them, and how operational decisions are enforced across system boundaries — have purchased a very expensive observation system: a set of dashboards that reports on instability without preventing it.
In manufacturing, the clearest expression of this gap is the quoted-vs.-realized margin. Every manufacturer knows what margin they quoted. Far fewer know what margin they actually delivered — by job, by customer, by rep — in real time, while there is still something to do about it. The ERP has the data. The CRM has the customer signals. Finance has the actuals. The gap between those three sources and a unified, live margin view is not a technology gap. It is an orchestration gap.
Digital maturity is not a function of software density. It is a function of execution authority. A manufacturer with a lean stack, live job margin visibility, historical quoting data, and automated alert workflows is more operationally mature — in every meaningful sense — than a competitor running 130 systems connected by email threads and gut-feel spreadsheets.
The transition from the latter to the former does not require replacing what has been built. It requires building the one thing that most digital transformation roadmaps have omitted: the intelligence layer that connects the data already in the systems, surfaces the margin consequences of every gap, and routes the right signal to the right person while there is still time to act.
SaaS platforms provide capability. Margin intelligence provides authority. Stop accumulating the former. Build the latter.
Stop Accumulating Tools. Start Seeing Margin.
Find out exactly where your margin is leaking — by job, customer, and rep — before investing in another system. The audit takes 10 minutes and delivers real dollar figures, not a strategy deck.
Free · No sales call · Results in under 10 minutes
References & Data Sources
- BetterCloud. (2025). State of SaaS 2025 Report. 12th annual study; ~600 IT professional respondents. Key findings: average 106 SaaS apps per company (2024), down 18% from 2022 peak of 130; IT-to-FTE ratio climbed 31% YoY to 1:108. Available: prnewswire.com/news-releases/state-of-saas-2025.
- Zylo. (2025). SaaS Management Index 2025. Average company holds 275 applications; 84% of enterprise apps and 74% of SaaS spending outside IT's direct responsibility; SaaS cost per employee averages $4,830. Available: zylo.com.
- WalkMe. (March 2025). Digital Adoption Study. Average large enterprise lost $104M to digital inefficiencies in 2024; employees lose 36 workdays annually to IT friction; average large enterprise believes it uses 37 apps but actually uses 625. Reported in CIO.com, March 27, 2025.
- BetterCloud / Statista. (2024). Average number of SaaS applications per company, 2015–2024 historical data. 2017 baseline of 16 apps; 2022 peak of 130. Available: statista.com/statistics/1233538.
- Backlinko. (December 2025). SaaS Statistics 2026. Organizations now average 112 SaaS apps — up from 16 in 2017; enterprise (5,000+ employees) averages 131–158 apps depending on measurement methodology. Available: backlinko.com/saas-statistics.
- Boston Consulting Group (BCG). Analysis of 850+ companies. 35% of digital transformation initiatives meet stated value targets globally. Cited in multiple 2025 synthesis reports.
- Bain & Company. (2024). Business transformation analysis. 88% of business transformations fail to achieve their original ambitions. Cited in blog.mavim.com and meltingspot.io, 2025.
- Gartner. (2024). Digital transformation survey. 48% of transformation projects fully meet or exceed targets; shadow IT accounts for 30–40% of IT spending in large enterprises. Cited in multiple industry reports, 2024–2025.
- McKinsey & Company. (2025). State of AI. Organizations that redesign workflows before selecting AI tools are approximately 3× more likely to achieve significant business impact.
- IBM. (2024). Cost of a Data Breach Report 2024. One in three enterprise data breaches originates from shadow IT. Average breach cost: $4.88 million. IBM Security.
- IBM. (2025). Cost of a Data Breach Report 2025. Shadow AI breach: additional average cost of $670,000 per incident. Shadow AI caused security breaches at 20% of organizations surveyed. IBM Security.
- Gartner / Forrester. (2024). Prediction: 75% of employees will acquire, modify, or create technology without IT oversight by 2027 (up from 41% in 2022). Shadow IT accounts for 30–40% of enterprise IT spending.
- Quanzar Technologies. (2026). Margin Intelligence · Quote Intelligence · AI Ops Layer · Revenue Leak Tracker. Product documentation and pilot engagement outcomes. Available: quanzar.com/margin-intelligence, quanzar.com/quote-intelligence, quanzar.com/ai-ops-layer, quanzar.com/revenue-leak-tracker.
Note on impact ranges: Operational improvement ranges cited in the comparison table are directional benchmarks derived from documented enterprise workflow automation and orchestration implementations, consistent with Quanzar pilot engagement outcomes. They represent typical outcome ranges, not contractual guarantees, and vary based on organization size, complexity, and current baseline state.